Cos
Tan
Sin
Sunday, January 23, 2011
Tuesday, January 4, 2011
Graph of Trigonometric Function
Applet
Steps:
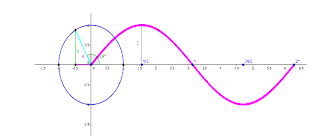
Graph of Sin Function
1.Open a new geogebra file.
2.Mark the intersecting point O of X and Y axis.( Intersect Two Objects tool)
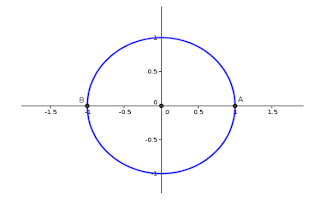
3.Draw a circle with centre at O and radius 1. ( Circle with Centre and Radius tool)
4.Mark the intersecting points Aand B of the circle with the X axis.( Intersect Two Objects tool)
.
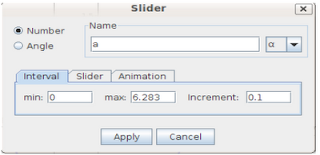
5.Click on the slider button and click once on the screen.
6.Apply the settings below and click apply .
.
7.Using the tool Angle with given size , first click at A and then at O. At that tme a dialog box will appear as shown below. Remove the value 45o and insert the name of the slider namely a and click OK.
.
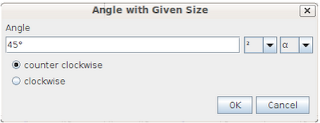
A new point C will appear on the circle. When we move the slider, the new point will move along the circle.
8.Draw a line through this point C which is perpendicular to the X axis.
9.Mark the intersecting point D of this perpendicular line with the X axis.
10.Using the tool Polygon draw a right triangle OCD and hide the perpendicular line.
11.Click once in the Input Field.
12.Type (a,0) in the Input field and press Enter. A new point E will appear on the X axis. When we move the slider, the new point will move along the X axis.
13.Draw a line through this point E, which is perpendicular to the X axis.
14.Draw a line through C, which is parallel to the X axis.
15.Mark the intersecting point F of the above two lines and hide the two lines.
16.Right click on F and give tickmark to the Trace On option.
17.Give animation to the slider. ( Right click on the slider --> give tickmark to the Animation On option).
18.Save the file.
Steps:
Graph of Sin Function
1.Open a new geogebra file.
2.Mark the intersecting point O of X and Y axis.( Intersect Two Objects tool)
3.Draw a circle with centre at O and radius 1. ( Circle with Centre and Radius tool)
4.Mark the intersecting points Aand B of the circle with the X axis.( Intersect Two Objects tool)
.

5.Click on the slider button and click once on the screen.
6.Apply the settings below and click apply .

.
7.Using the tool Angle with given size , first click at A and then at O. At that tme a dialog box will appear as shown below. Remove the value 45o and insert the name of the slider namely a and click OK.
.

A new point C will appear on the circle. When we move the slider, the new point will move along the circle.
8.Draw a line through this point C which is perpendicular to the X axis.
9.Mark the intersecting point D of this perpendicular line with the X axis.
10.Using the tool Polygon draw a right triangle OCD and hide the perpendicular line.
11.Click once in the Input Field.
12.Type (a,0) in the Input field and press Enter. A new point E will appear on the X axis. When we move the slider, the new point will move along the X axis.
13.Draw a line through this point E, which is perpendicular to the X axis.
14.Draw a line through C, which is parallel to the X axis.
15.Mark the intersecting point F of the above two lines and hide the two lines.
16.Right click on F and give tickmark to the Trace On option.
17.Give animation to the slider. ( Right click on the slider --> give tickmark to the Animation On option).
18.Save the file.

Sunday, January 2, 2011
Integration

Integration
Applet
1. Open a new geogebra file.
2. Click once in the Input Field.
3. Type x^2 in the Input field and press Enter. (f(x)= x2)
4. Type Integral [f,0,3] in the Input field to display the area under the parabola from 0 to 3.
The area measurement is displayed in the Algebra window.
5. Click on the move drawing pad button and drag the graph down to the bottom right of
the screen so all of the area under the curve is visible.
6. Click on the slider button and click once on the screen.
7. Apply the settings below and click apply

8. Click in the Input Field and type UpperSum [f ,0 ,3, n] and press Enter.
9. Click on the arrow button and drag the slider n to see the area of the rectangles approach the exact area.
10. Right click on the slider, choose Properties and click the slider tab to change the max
value to 200.
11. Drag the slider again.
12. Save the file.
Subscribe to:
Comments (Atom)